Rental Values & Vacancy Rates
As the covid-fog begins to clear let’s take a moment to review what we have seen from the data over the last couple of months and what we need to focus on as we begin to create our future.
Given we are only at the beginning of the new rental landscape and property market in general there is much uncertainty and many and varied opinions on where this future will take us. There is no doubt that the affects will be far reaching and the timeframe uncertain.
That said, there are a lot of reasons to be positive. We are getting back to work sooner than expected, restrictions are easing almost daily, the curve has been subdued and spending is trickling through the system again. One might consider the projections back in March being based on much more dire outcomes than we have experienced to date.
Over 600,000 Australians lost their jobs and the unemployment rate today is at 6%. Small businesses whilst receiving job keeper have been given a lifeline but not all small businesses qualified. There is still hurt out there and this is being reflected in tighter banking compliance right across the spectrum.
Rental Values
For the week ending 28 May 2020, the average weekly rent across Australia increased by 1% for houses and decreased by 1% for units, compared to the week prior.
Sydney’s rental listings were up by 15 per cent over the past 12 months causing house rentals to fall by 6 per cent and units by 4 per cent in the four weeks to April 20, according to the analysis. Financial Review.
Month on month, the national weekly rents rose by 0.5% for houses and 0.3% for units. Sydney, Melbourne, Perth and Hobart recorded overall declines in weekly rents while Brisbane and Adelaide recorded overall increases. (sqm research). SQM Research Managing Director Louis Christopher said that this was “the biggest renters’ market” he has seen in his 20-year career. “From what we can see in the data, it’s actually been the upper end of the market that’s been hit the hardest.”
At MyPlace we are seeing the consequences of covid result in reductions in rent. It was challenging especially in the beginning when navigating the needs of landlords and tenants. Our experience was that our Landlords and Tenants worked together for the most part. A rather unsavoury position for most landlords to be in to be fair, but with careful negotiation between parties and our Senior Property Manager Emma taking it on with compassion and grit we have managed to come through in what we hoped is the best outcome for all. As you can see compared to other days on market and price reduction trends locally, we have successfully managed to minimise price reductions and reduce days on market.
Tenants have so much choice at the moment and rents are very competitive. We are starting to seeing longer days on market for rental properties across the board, but the last couple of weeks we have experienced some bouancy in enquiries and tenancys being secured successfully.
Botany:
previously rented for $1,025pw, leased for $950pw in June
would typically rent for $565 – $580pw, leased for $530pw in June
Eastlakes:
previously rented for $470pw, leased for $385pw in June
previously rented for $460pw, leased for $380pw in April
Beaconsfield/Alexandria
previously rented for $960pw, on the market now for 900pw
previously rented for $700pw, on the market now for $650pw
Kensington: (Particularly tough due to uni’s being closed, international students returned home)
previously rented for $595pw, leased for $510pw
previously rented for $875pw on the market now for $700pw
City areas:
previously rented for $750pw leased in May for $650pw
previously rented for $585pw, leased in May for $540pw
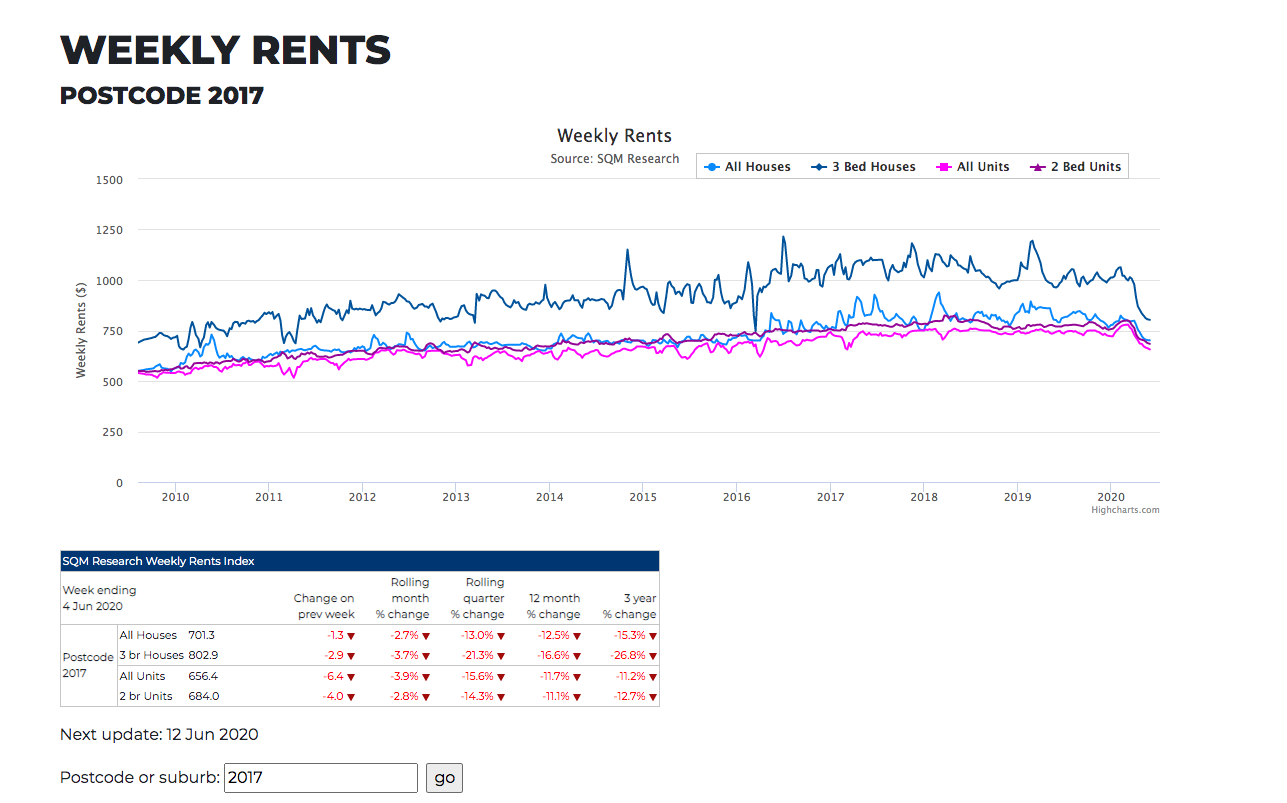
To see what is happening in your suburb click on the link to view a host of great charts and information. Today’s investor wants to be empowered and have the information when they want it. When building our data and opinions we consult a wide variety of sources. Instead of flooding you with charts around our local area I thought today I will point you to a great website where you can view your own suburb and get lost in the numbers if that is your bent!
I believe that if the information is out there you should be able to view it. This link is very user friendly and FREE!
https://sqmresearch.com.au/weekly-rents.php?postcode=2017&t=1

Vacancy Rates
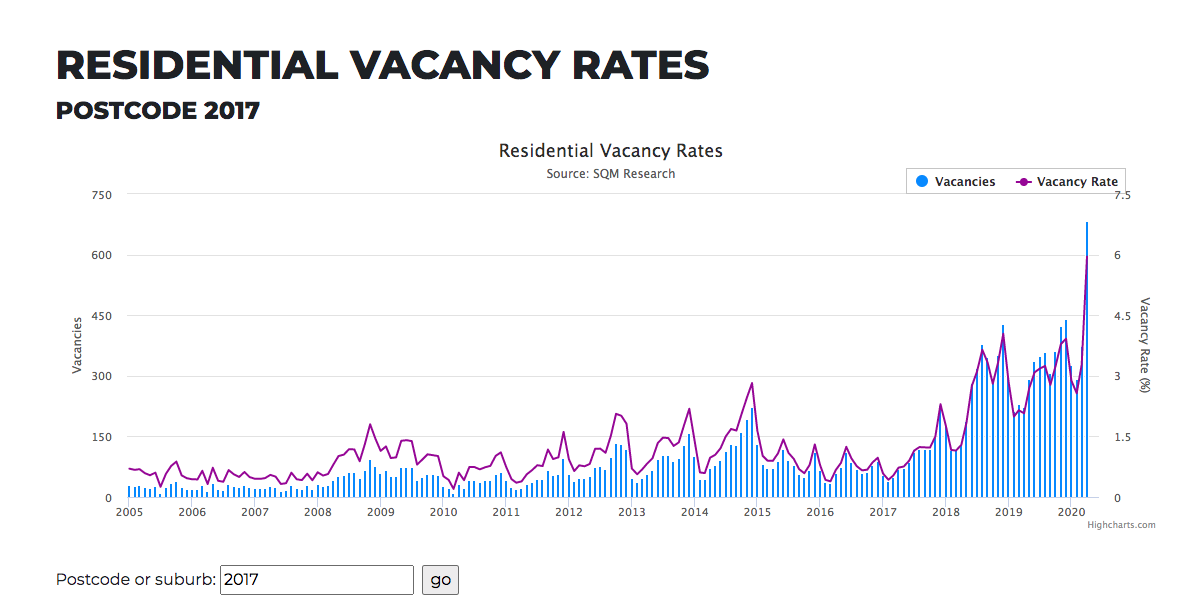
It is no surprise that there has been a surge in vacant properties. Migration halted, students moving home with parents, renters relocating to outer suburbs for affordability due to job losses. AirB&B properties moving to longer term rentals and an oversupply of off the plan residences all creating a perfect storm.
Year on year, the national residential vacancy rate is 0.3% higher than the 2.3% recorded in April 2019. Additionally, most capital cities recorded a higher vacancy rate compared to the same time last year. There has never been a better time to rent, that is, if you still have your job.
Use this link to enter your suburb: https://sqmresearch.com.au/graph_vacancy.php?postcode=2017&t=1
Vacancy Rate Zetland

As we brace for the future we must remember how far we have already come in a few short months. There is much more to play out in this story. I have also included the latest Core Logic video brace yourself it is a short 7 minutes but you will be bashed around the with all the latest statistics a great watch. Well worth it.
For assistance with any rental properties or simply to request a rental appraisal contact Emma 8303 1800 or myself.
https://www.corelogic.com.au/housing-update
Stay well.
Sandra